We worked closely with Pat McGee of the Katz Radio Group and Media Monitors to pull the following information. We wanted to quantify the amount of TV clutter leading up to the last presidential election, recognizing it can serve as a harbinger as to what we can expect this year.
The analysis below included the three main broadcast networks, ABC, CBS, and NBC during their early and late news and summarizes; the percentage of total commercials which were political and the average number of political commercials per break, one and two months prior to the 2012 presidential election.
The chart below summarizes broadcast network late news’ political commercial load 60 days in advance of the 2012 election:
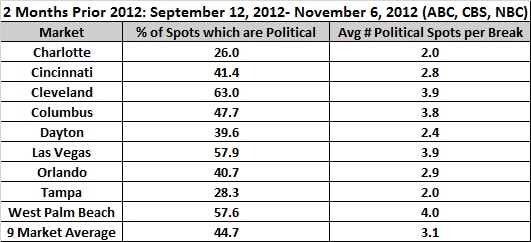
Depending on the market, 26-63% of all commercials were “political” in these news broadcasts, with the average being 45%.
As one would expect, the clutter intensifies as the election approaches. This chart summarizes network news’ political ad load 30 days prior to the election:
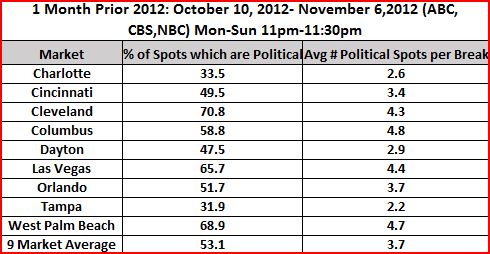
The nine-market average for this period was almost four political commercials per break with political ads accounting for over half (53%) of all commercials that aired.
Let’s now quantify the television early news commercial environment:
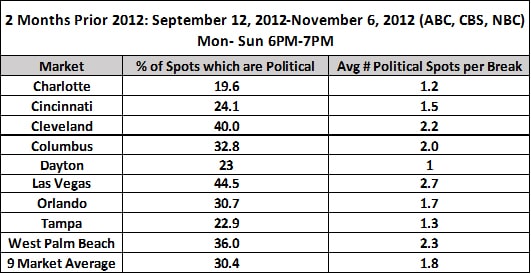
Unquestionably, there is a similar clutter issue in early news as there was in late news, as on average, two months prior to the election, 30% of all ads were political in nature.
We’ll now take a stab at quantifying the total number of political commercials an “average” television viewer would have been exposed to within 60 days of the 2012 election in these markets. For this exercise, we’ll assume that the viewer watched the early news and late news daily, on either ABC or CBS or NBC for the two months prior to the 2012 presidential election.
The average number of political ads running in late night news on each of these three networks was 505 and the average number of political ads running in the early evening news on each of these networks was 596. So, combined, a viewer would have been exposed to 1,101 political ads in early and late news. We believe this figure actually understates actual political ad exposure due to channel switching during commercial breaks.
And this total reflects only 90 minutes of daily TV viewing. According to Nielsen, the average adult watches five hours of television per day, which means there’s another 3 ½ hours of daily TV viewing where the viewer was also be exposed to additional political messaging.
Let’s assume that the concentration of political commercials in network news programming is twice that of other television programming, both cable and network.
By doing the math, we come up with the average TV viewer in these nine markets being exposed to approximately 2,400 political (40 daily), largely negative commercials in only the 60 days prior to the 2012 presidential election — the heaviest TV viewers would have been exposed to over 6,000!
How many other political ads were they were exposed to prior to this 60-day window is anyone’s guess.
The radio-commercial environment, on the other hand, is much cleaner. Only 11% of the commercials were political throughout the day, Monday-Sunday 6 a.m.-7 p.m., with a political commercial running roughly every other commercial break.
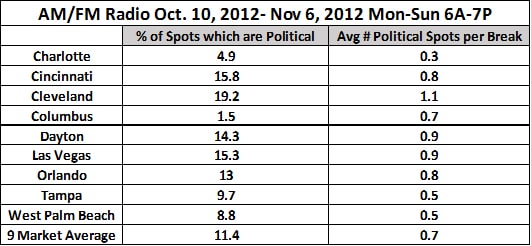
If you are a general market advertiser and you want your ad to air in the proper environment, think radio. If you are a political candidate and you are interested in getting elected, make sure your campaign gives the radio medium another look before it’s too late.
Again, our sincere thanks to the Katz Radio Group and Media Monitors for making the “mining” of this data possible.