


(By Bob McCurdy) Taking a different approach to make the same point is often effective. Frequently in sales it is necessary to communicate the same thing, only differently, so that the message remains fresh, registers, and is not ignored.
The following hands-on, interactive exercise, be it in-person, in a lunch-and-learn, or via an e-blast might be a different enough twist to reinforce the contrasting profiles of the heaviest TV viewer and the heaviest radio listener. Many advertisers actually do concede there is a difference, but few allocate their ad dollars in a manner that reflects the magnitude and appreciation of this difference.
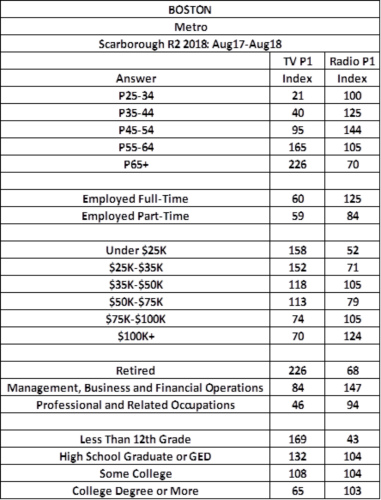
What follows, focuses on the heaviest TV viewers in Boston (A18+ indices/latest Scarborough) but the profile below would be virtually identical for any market. National Nielsen data confirms this fact. There are instructions toward the end that detail how a similar analysis can be easily replicated for any market.
The bottom line is that the heaviest P1 TV viewers (20% of viewers) view 40%-50% of all paid TV gross impressions, which means the data below should be of interest to any TV advertiser.
Since people learn and retain more when they are actively engaged, let’s simulate a game many of us played in grade school — matching the correct number with the appropriate category.
Note before proceeding that the larger the index, the more likely the heaviest TV viewer is to fall within that particular category.
Here we go. Match the following indices 95, 165, 226, 40, 21 with the appropriate demographic that reflects the viewership demo profile of the heaviest Boston TV viewer.
A25-34___A35-44___A45-54___A55-64___A65+___
If you guessed the following, you were correct:
A25-34: 21
A35-44: 40
A45-54: 95
A55-64: 165
A65+: 226
Takeaway: The heaviest TV viewer in Boston is more than twice (2.26x) as likely to be a 65+ adult than the average Bostonian, and one-fifth as likely to be a 25-34 year old adult.
Match the following indices, 60 and 59, that best reflect the employment status of Boston’s heaviest TV viewer:
Full-Time Employed___ Part-Time Employed___
If you guessed the following, you were correct:
Full-Time Employed: 60
Part-Time Employed 59
Takeaway: The heaviest TV viewer is 40% less likely to be employed than the average Bostonian.
Match the following indices of Boston’s heaviest TV viewer with the appropriate household income 158, 70, 113, 118, 74, 152:
Under $25K___$25K-$35K___$35K-$50K___$50K-$75K___$75K-$100K___$100K+___
If you guessed the following, you were correct:
Under $25K: 158
$25K-$35K: 152
$35K-$50K: 118
$50K-$75K: 113
$75K-$100K: 74
$100K+: 70
Takeaway: The heaviest TV viewer is 58% more likely than the average Bostonian to have a household income less than $25,000 and is 30% less likely to reside in a $100,000+ household. By the way, the median HHI of Boston radio’s heaviest listener is 71% higher than that of the TV heaviest viewer, meaning they have a lot more discretionary income.
Match the indices 84, 226, 46 with the appropriate occupational category of Boston’s heaviest TV viewer:
Retired___ Management___ Professional___
If you guessed the following, you were correct:
Retired: 226
Management: 84
Professional: 46
Takeaway: The heaviest TV viewer in Boston is more than twice as likely (2.26x) to be retired than the rest of the Boston metro, and 54% less likely to be a professional and 16% less likely to be in management.
Finally, match the following indices, 108, 132, 65, 169 with the appropriate level of education of Boston’s heaviest TV viewer:
Less than 12th grade___ High School___ Some College___ College+___
If you guessed the following, you were correct:
Less than 12th grade: 169
High School: 132
Some College: 108
College+: 64
Takeaway: The heaviest TV viewer is 69% more likely to have less than a high school education than the average Bostonian and 36% less likely to have graduated college.
Let’s now put TV’s heaviest viewer profile side-by-side with radio’s heaviest listener profile:
To summarize, the heaviest radio listener is:
- Far more likely to be 25-54 than the heaviest TV viewer.
- More than twice as likely to be full-time employed than the heaviest TV viewer.
- Is 77% more likely to have a household income of $100K+ than the heaviest TV viewer.
- Is 75% more likely to be in management and more than twice as likely to be a professional, than the heaviest TV viewer.
- Is 58% more likely to have graduated college than the heaviest TV viewer.
- Has a median HHI that is 71% higher than the heaviest TV viewer.
Doing a similar analysis for your market is quick and simple. Go to Tapscan:
- Click on the “IQP” option
- Click on “QualCategory”
- Scroll down to “Quintiles” (click)
- Then under the “Question” column scroll down to “TV Quintile” (click)
- Click on “Television 1st Quintile (heaviest),” then click “OK”
- Then click on “Apply Changes” in the upper right-hand corner.
Do the same for “radio.” Then cut and paste them together in Excel to create the chart above.
Simple yes, but sometimes simple is best and it might even be fun for those playing the “game” but the chances are it might be a more effective way to highlight the qualitative differences than a spreadsheet or PowerPoint slide.
Take it to the street and get your clients actively engaged in more firmly appreciating the facts. After all, who would they prefer to patronize their business?
Bob McCurdy is Vice President of Sales for the Beasley Media Group and can be reached at [email protected].


If Bob continues to supply the quality of materials as (above), he may, indeed, contribute to the business of radio struggling to, generally, get itself out of the mire.
Perhaps the premise of radio’s responsibility to improve its on-air and commercial production capacities may not be necessary after all.
Comments are closed.