(By Bob McCurdy) The following takes Charlie Sislen’s “heavy/light TV viewer” blog from last Monday a step further.
The chart below contains data extracted from the latest Ft. Myers Scarborough report and details the viewing habits of the Ft. Myers adult. This type of report requires a few steps but can be compiled easily for any Scarborough market and having done this for a number of markets, it’s safe to say that the data/results would likely be very similar.
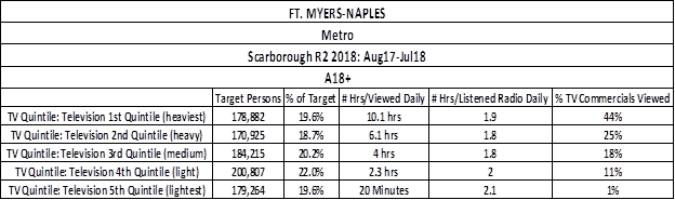
The heaviest TV viewer in Ft. Myers watches slightly over 10 hours of TV daily, with the lightest viewing 20 minutes. This fact alone is worth the price of admission as it points to the fact that the heaviest viewers watch close to 30x more TV than the lightest viewer, meaning they are likely exposed to 30x more TV commercials than the lightest TV viewer, hence the frequency imbalance that Charlie referenced last week.
The other takeaway from this chart is that the lightest TV viewer happens to be a big radio fan, tuning to AM/FM over two hours a day, or 6x the amount of time they spend watching TV. Also note that TV’s heaviest/heavy viewers view 69% of all paid commercials, with the light and lightest TV viewers only exposed to 12% of all TV commercials. This data reinforces the fact that 40% of all viewers will have little chance of being effectively reached by any Ft. Myers TV campaign.
The percentages are not that much different for radio. Forty percent of radio listeners are classified as heavy/heaviest listeners and these radio fans account for 72% of total radio listening. It would not be much different if we looked at McDonald’s, Charmin, wine consumption, or any other product or service. So the 80/20 rule is more like a 70/40 rule. This ratio would roughly hold true for other markets, products, media consumption, etc.
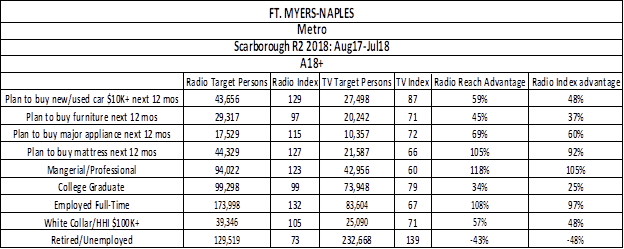
The above was needed to set the stage for the chart below. While reviewing, keep in mind that the heaviest 40% users of both TV and radio consume approximately 70% of all commercials. Let’s now see how radio and TV’s heavy/heaviest users compare when looking at propensity to purchase various products and their socioeconomic profile.
Take a minute to digest this chart and let its implications sink in. It’s quite an impressive story for radio.
Let’s look at those intending to purchase a new/used automobile costing $10,000+ in the next 12 months. The heaviest/heavy radio users number 43,656 in Ft. Myers and are +29% more likely to do so than the average resident, while the heaviest TV viewers number 27,498 and are 13% less likely to do so than the average resident. The result is a +59% reach advantage for radio and a +48% advantage with index, meaning the heaviest/heavy radio listeners are +48% more likely to be purchasing a new/used car valued $10,000+ in the next year than the heaviest TV viewers. Keep in mind these are the viewers/listeners who will be gobbling up 70% of any advertiser’s paid gross impressions, aka ad budget.
It’s a similar story with those planning to buy furniture, appliances, or mattresses in the next 12 months. Radio’s considerable advantage also extends to college graduates, professionals/managers, and those employed full-time. Be sure to take special note of the “retired/unemployed” data.
There are terrific stories to be discovered using Scarborough and other data sources that not only need to be unmasked but effectively communicated. Clients that “know” what we “know” are more likely to “believe” what we “believe,” which is a good thing. We leave these kinds of stories unveiled and untold at our own economic risk.
Bob McCurdy is Vice President of Sales for the Beasley Media Group and can be reached at [email protected].