


(By Bob McCurdy) I was in a market last week and the subject of audience rank came up when speaking with an Account Executive. This individual handled several agencies that were focused on only purchasing the top five or six stations in a target demo.
In today’s listening landscape, many stations are separated by only a tenth or two of a rating point, which greatly impacts rank and, in reality, statistically speaking, there’s little if any actual audience difference between these stations. The reason for this is simple. Nielsen audience ratings are statistical estimates and all statistical estimates, Nielsen or otherwise, are subject to varying degrees of “variability” as they are based upon a sample and not a census.
Nielsen readily acknowledges that their audience estimates are less than perfect proxies of actual listenership in their e-book, stating, “Clients should be mindful that — due to the limitations described in Chapter 16 of this Local Radio Syndicated Services Description of Methodology — it is not possible to determine the reliability of our estimates, data, reports and their statistical evaluators to any precise mathematical value or definition.”
So much for only focusing on purchasing the top five or six stations.
Let’s quantify this variability. There’s a statistical formula called “Difference between two means” that enables us to quantify the likelihood that one Nielsen audience estimate, in this case an average rating, is truly larger than another. This computation can assist us in pushing rank aside and begin having meaningful conversations with decision-makers about things that really impact an ad campaign — like qualitative, audience composition, personalities, creative, promotions, commercial placement, testimonials, success stories, etc.
Let’s look at a couple of current market examples using this formula:
In a PPM market, the #4 ranked station in the A25-54 demo has a 0.5 Mon-Fri 6A-7P average rating. The #14 station in the same demo and daypart has a 0.4 average rating. Doing the appropriate computations utilizing the formula referenced above, we find that statistically speaking there’s only a 52% chance that the #4 station’s audience is actually larger than #14’s, and a 48% chance there is no difference. So, from a ratings standpoint, it’s a complete toss-up, a coin flip — 50/50.
In a diary market, the #5 station has a 0.7 Mon-Fri 6A-7P average rating and the #11 station has a 0.5 average rating. Again, there’s only a 52% chance that #5’s audience is actually larger than #11’s, and a 48% chance there is no difference. Another coin flip, toss-up.
Why is knowing this important?
- Our sales currency is based on statistics so we should be familiar with both its strengths and limitations.
- We should not allow a lower Nielsen audience rank to negatively impact our rate, share expectations, or our “perception” of a station.
Over the next few months, we all will be increasingly subjected to political polls. Always be sure to note the +/- figures referenced at the bottom. That’s the standard error surrounding the results of that poll. And, Nielsen being a radio listening “poll,” is subject to standard error as well.
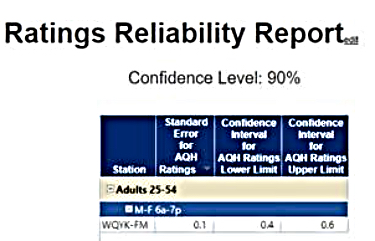
Spend some time at rre.Nielsen.com/Tapscan/ to get a first-hand view of the variability surrounding audience estimates. The chart below is compiled from the Tampa market using Apr/May/June 2018 data for WQYK, which can be read, we can be 90% sure, to say WQYK’s actual A25-54 Mon-Fri 6A-7P audience rating would fall between a 0.4 and a 0.6. There’s also a 10% chance the actual audience rating would fall outside this 0.4-0.6 range.
How could this “confidence interval” impact WQYK’s audience rank? A 0.4 would have it tied for #11 in the market and a 0.6 would have it tied for #2.
Again, so much for the logic of buying off rank.
Nielsen does a terrific job of measuring radio listening in this competitive, fragmented radio landscape, and it is the currency by which we sell. But we should also keep their own words in mind when dealing with anyone who is viewing or buying off of radio audience ratings as if they were carved in stone — “it is not possible to determine the reliability of our estimates, data, reports and their statistical evaluators to any precise mathematical value or definition.”
Bob McCurdy is Vice President of Sales for the Beasley Media Group and can be reached at [email protected]

Even when Bob delivers (or exposes) relavent information, the go-to position from the radio group is more about “whose oxen is getting gored”.
If they own stations that are represented well by the ratings – no worries. If they own stations that rank poorly in the ratings – the ratings game is determined to be a fixed, mug’s game.
Improvement of the media as a result of internally-motivated considerations and strategies are swept off the table. And besides, they have summarily been snorgled up by the dog.
For one like myself that has no ratings this was a good read. It’s like saying … there is no one listening to your stations. And we both know that is bull shit. Poor buying decisions are based on ignorance and laziness is not working in the best interest of the client. I hate the book rating and ranker thumpers. That is the only way they know how to sell. The more stations the louder the thump. Oh … and every market has a queen bee. (someone who has been at a station forever and a supposed expert in thumping)
Time to quit bitching and get on with the ongoing message. “People are listening to my stations people” really?